
Reporting
Running reports
The Reports page turns your entry records into attendance reports: pick a date range, filter by site, company or person and read the charts, per-person tables and CSV exports that update together.
5 min read · 3 steps
- 1
Pick a range plus filters
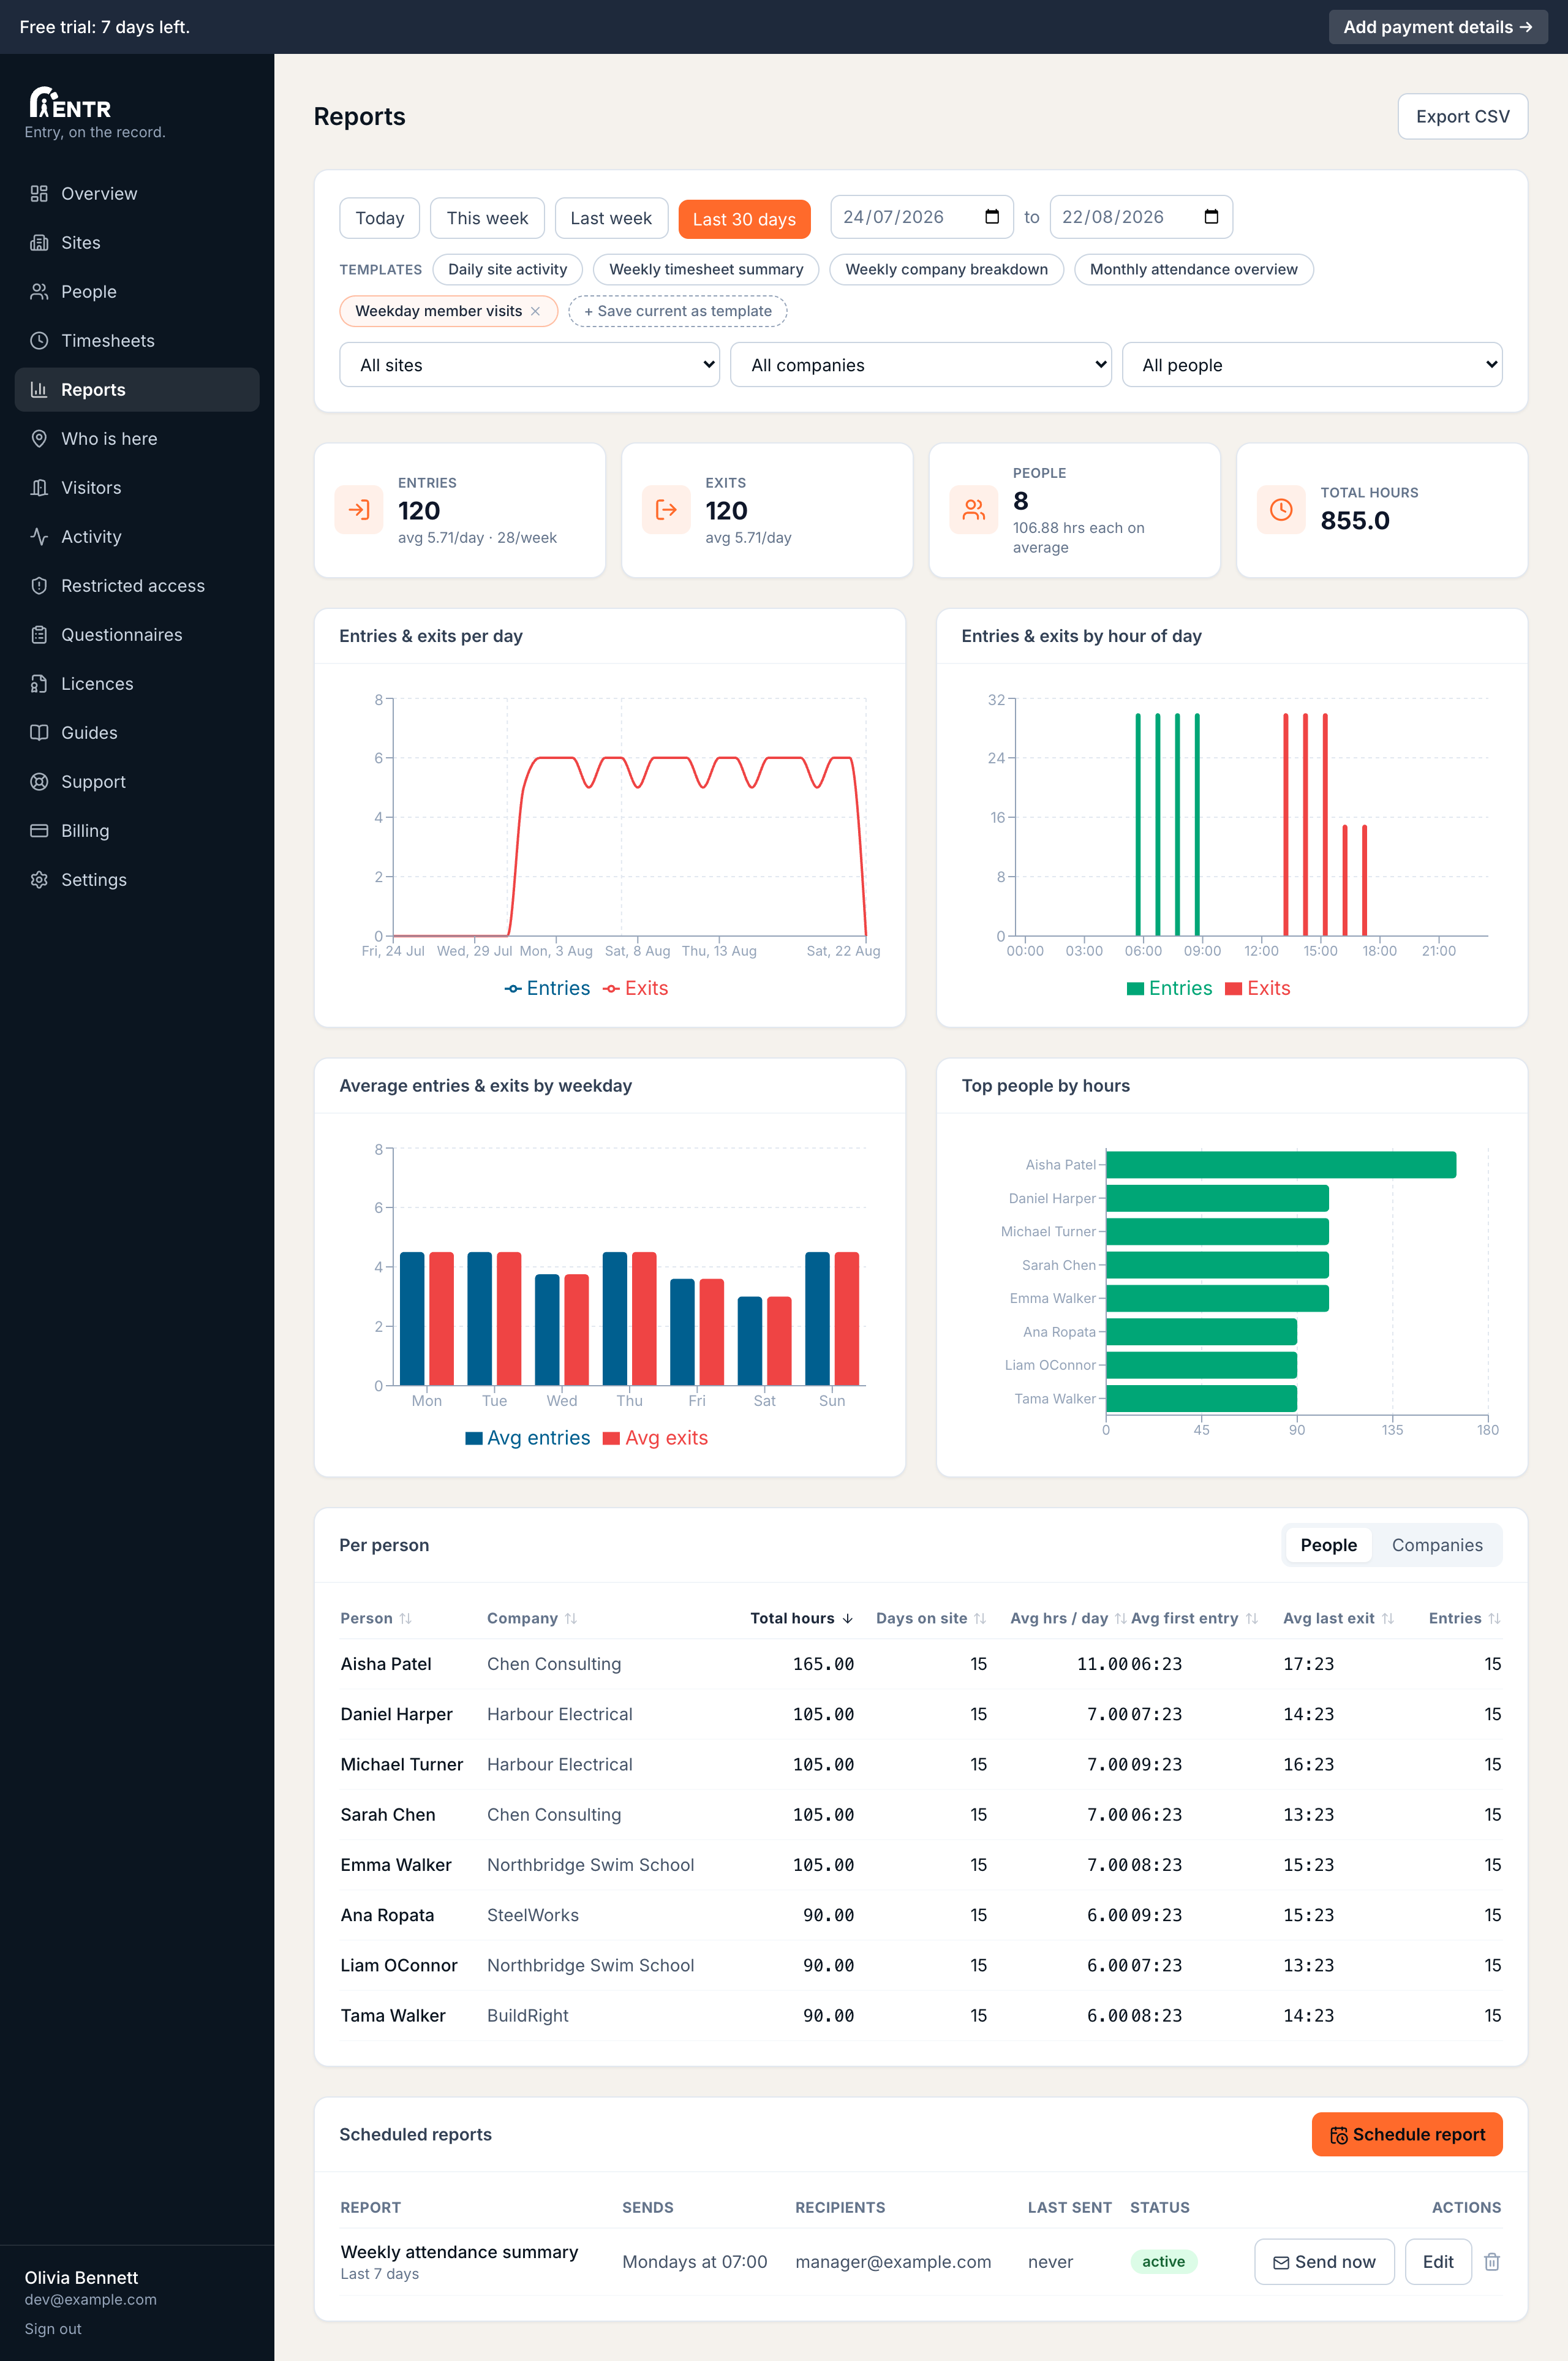
The Reports page opens on the last 30 days. Quick presets (Today, This week, Last week) sit beside a custom date picker. Filter by site, company or a single person: every chart plus table below updates together.
- 2
Read the charts
Summary cards show entries, exits, people, total hours. Charts break the window down per day, by hour of day, by weekday, plus the top people by hours: enough to spot quiet days or peak-hour crushes at a glance.
- 3
Per person, per company
The table at the bottom switches between People (hours, days on site, average first entry, average last exit) and Companies (people, hours, entries per employer). Export either view as CSV with the button at the top right.
Using iENTR at a construction site? See how the whole system fits your door.
iENTR for construction →Related guides
Try it on one door.
Seven days free, cancel any time. Mount the iPad, pair it with one code and you are running inside half an hour.